What it does, in one evening
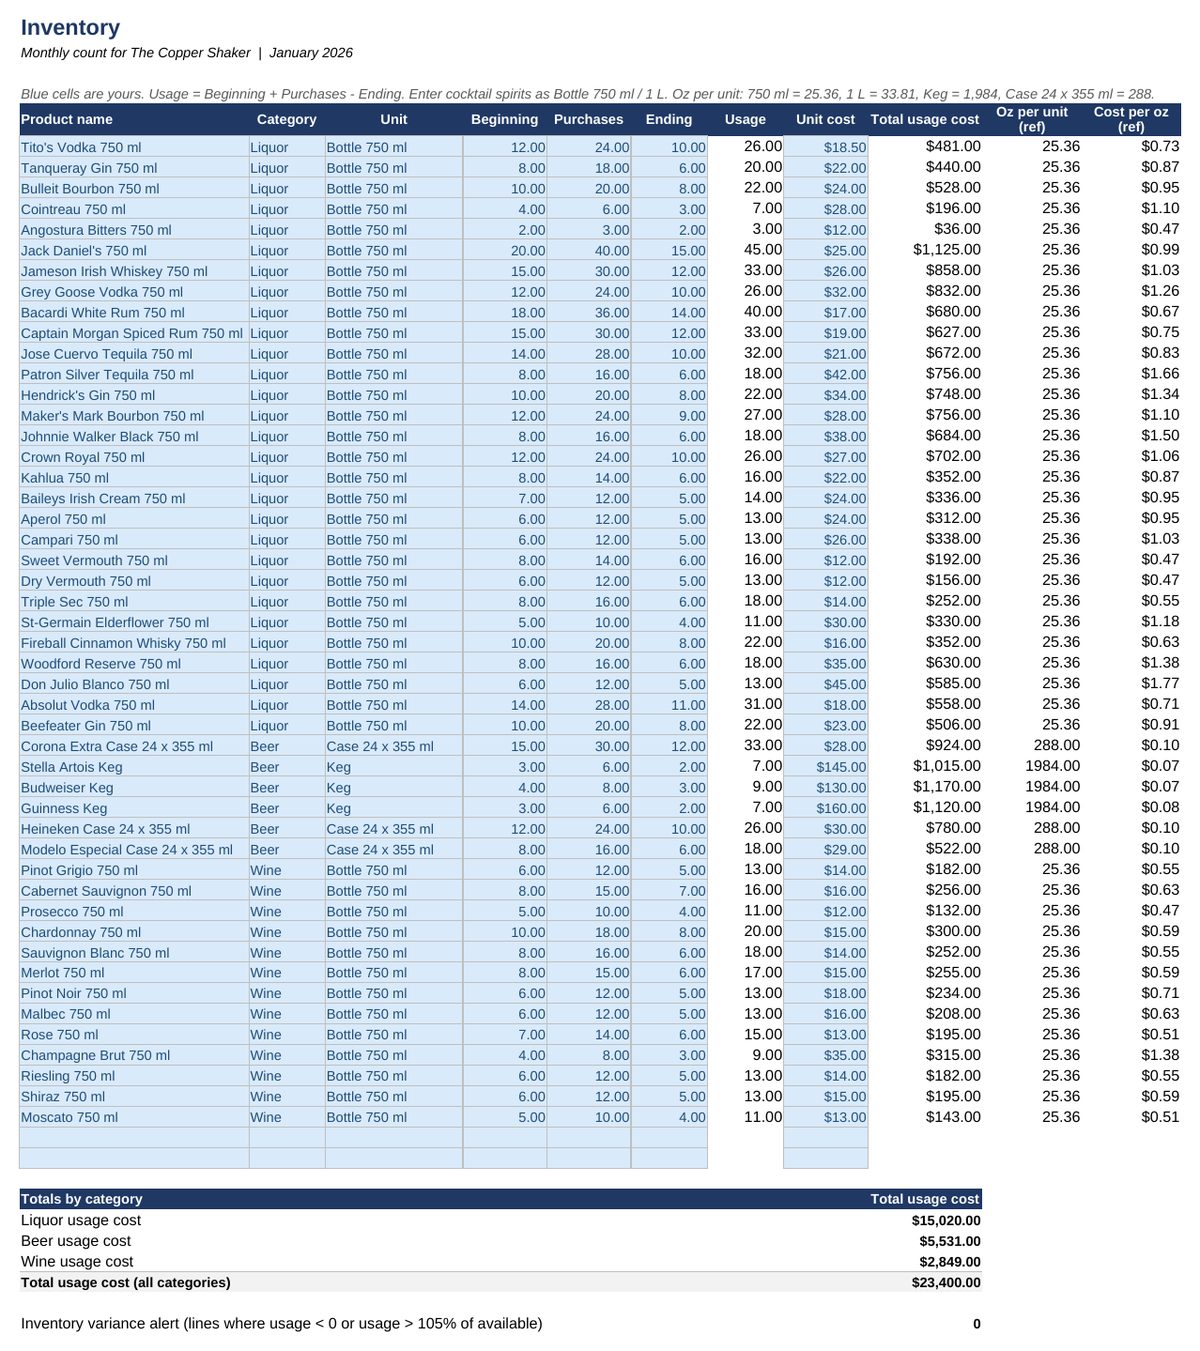
- Inventory — 50 products (liquor, beer, wine), beginning + purchases − ending = usage, usage cost by category, cost per ounce for recipes, and a variance counter that flags impossible counts.
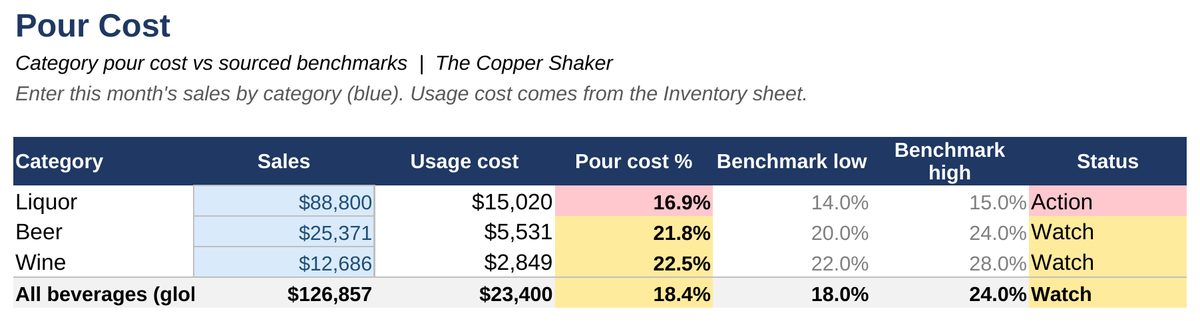
- Pour Cost — liquor, beer, wine and total pour cost %, each against a sourced range (BevSpot 2016 by category; MarginEdge 2026 for total beverage cost), green / yellow / red.
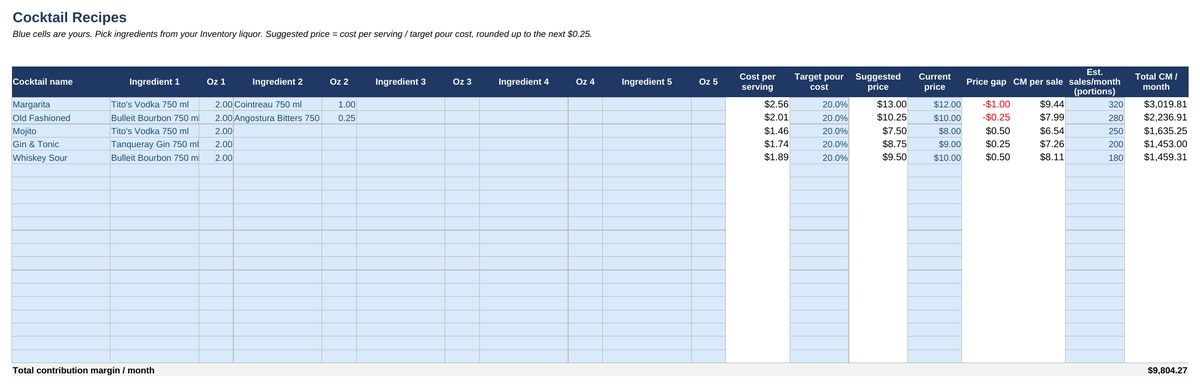
- Cocktail Recipes — 20 cocktails, 5 ingredients each pulled from your inventory: cost per serving, suggested menu price at an 18 / 20 / 22% target (rounded up to the next $0.25), gap with your current price, contribution margin per month.
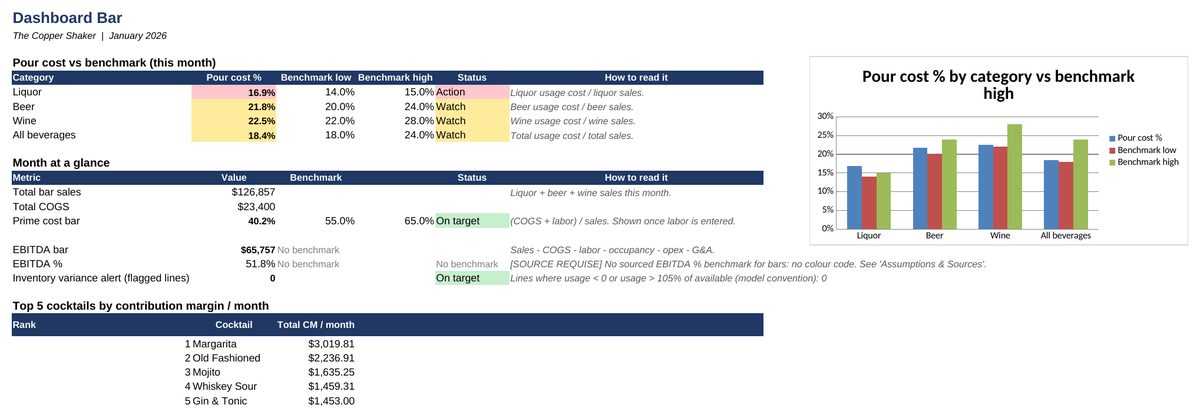
- Dashboard Bar — the five numbers a manager checks weekly, the top 5 cocktails by total margin, and a pour cost vs benchmark chart.
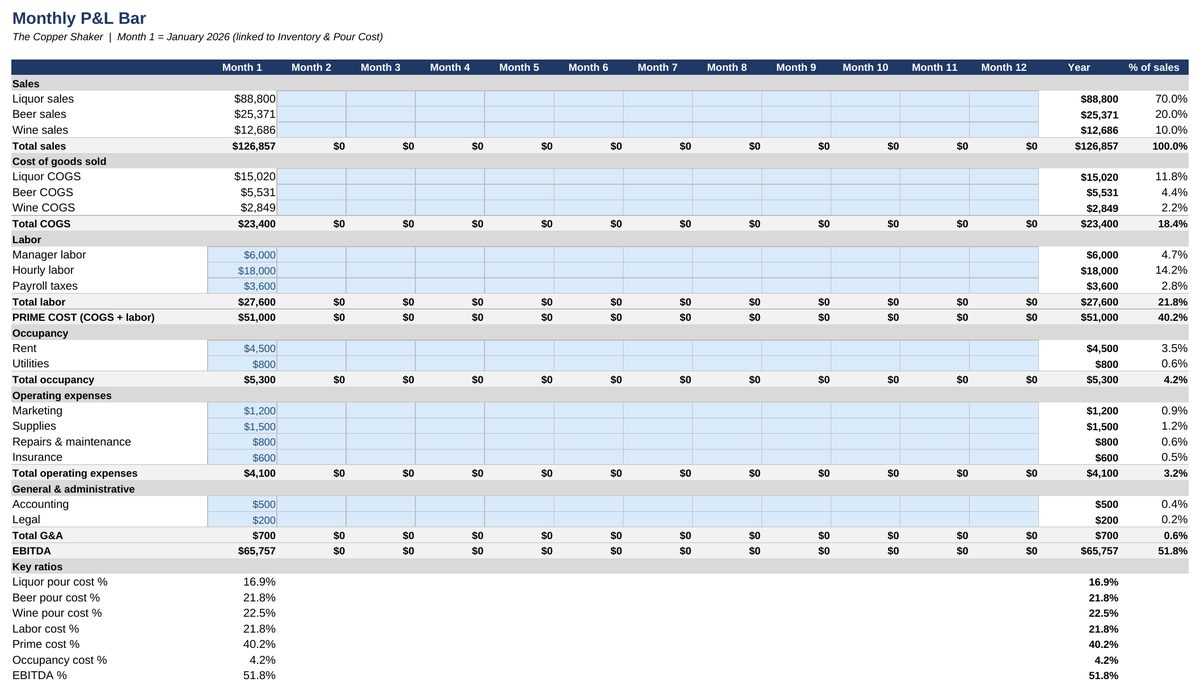
- Monthly P&L Bar — 12 months with labor, occupancy, operating expenses and G&A: prime cost and EBITDA with their ratios.
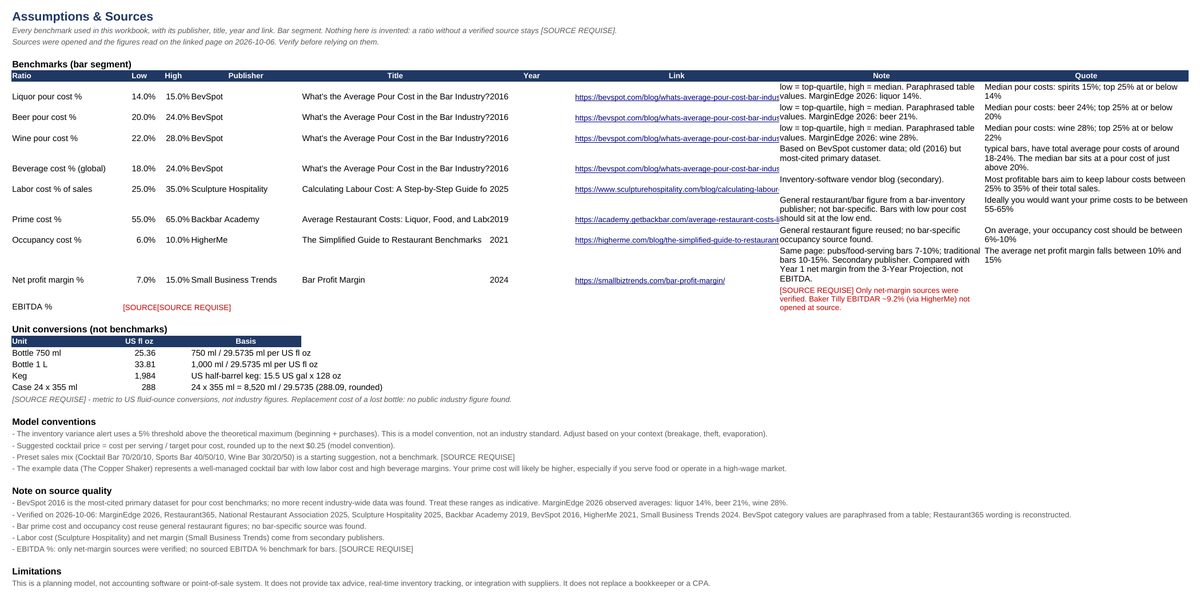
- Assumptions & Sources — publisher, title, year and link for every benchmark; where none is reliable, the sheet says "No benchmark".
Gallery
What it is not
It is not a POS integration and not a liquor-ordering system. It does not build a multi-year projection or a break-even for a lender — that is the Restaurant Financial Toolkit, and the bundle gives you both for $99 instead of $128.
Guarantee and support
Full refund within 14 days if the file does not work as described. Email support: outilfinance@gmail.com.
Who builds this

Elliot Pelletier · PrimeCost Lab · Québec, CanadaFinance student with hands-on experience in SMB financing analysis. I build the models I would want on the other side of a loan file: every benchmark sourced, every formula tested, and a free version that is actually useful. Not sure which file fits? Email me before you buy: outilfinance@gmail.com.