Prime cost, break-even per seat, menu pricing and a 3-year projection that prints on one page. Built in Excel by a finance student with hands-on experience in SMB financing analysis, priced for an operator.

Pick the line that sounds like you this week.
Ten numbers from your books, four ratios color-coded against sourced benchmarks. Excel or Google Sheets.
Free calculator →Monthly count, pour cost by category, every cocktail costed per ounce, a 12-month bar P&L.
Bar Tracker · $49 →Break-even per day and per seat, menu pricing, a 3-year projection with DSCR on one page.
Toolkit · $79 →You answer about 20 questions, estimates are fine. You get the file and a 2-page summary.
Done for you · $149 →En français ? Le calculateur gratuit du coût principal existe en français →
Seven free online calculators. Nothing is sent anywhere, no email asked.
Enter last month's sales, inventory, purchases and labor. Get food, beverage, labor and prime cost %, color-coded against sourced benchmarks.
Open the calculator →Fixed costs, average check and variable cost %. Get break-even sales, covers per month, per day and per seat.
Open the calculator →Recipe cost and target food cost % → suggested menu price, contribution margin, and the real food cost % of your current price.
Open the calculator →Bottle price, bottle size and pour for up to five ingredients → cost per drink, pour cost % and a suggested price at your target.
Open the calculator →Dose, bean price, milk and cup → real cost of a latte, its cost % at your price and a suggested price.
Open the calculator →Hours, wages, salaries, payroll taxes → labor cost % against the range for a restaurant, a bar or a cafe, and sales per labor hour.
Open the calculator →Headcount × turnover rate × cost per departure, with 2025 industry defaults. Per year, per month, share of sales.
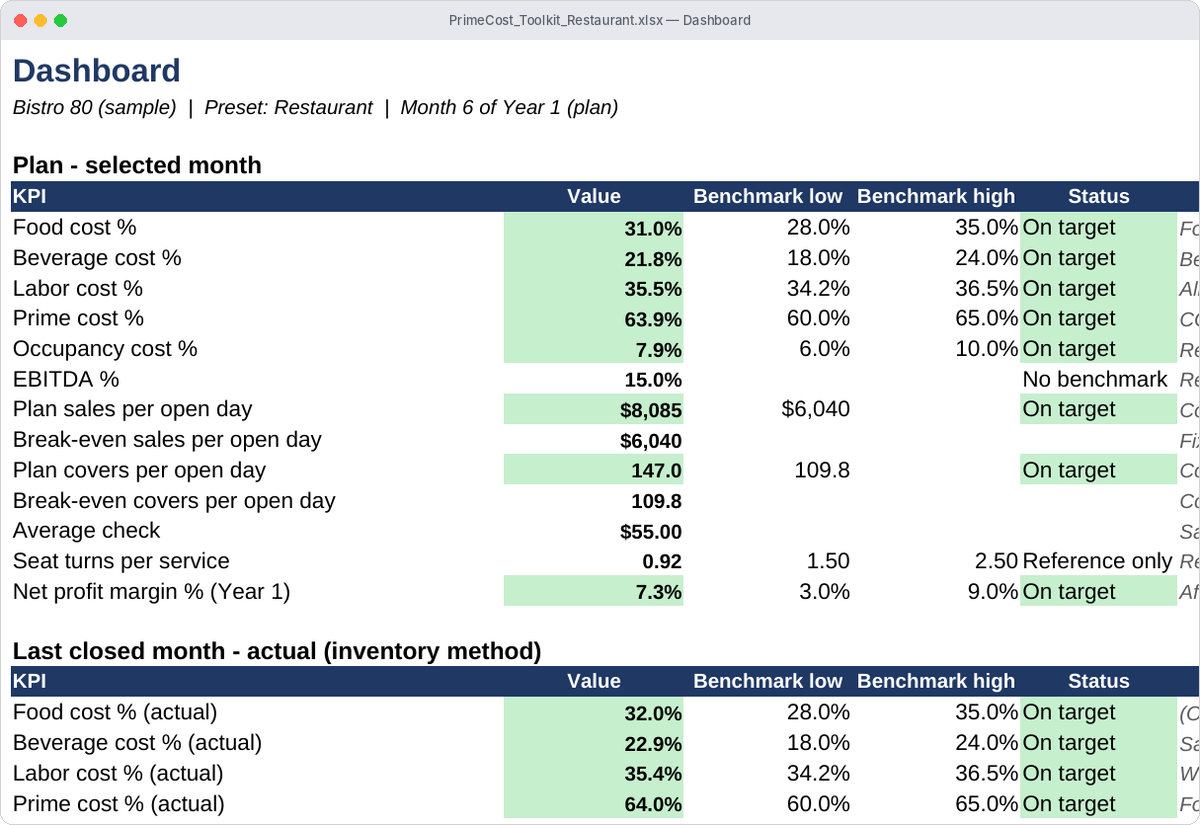
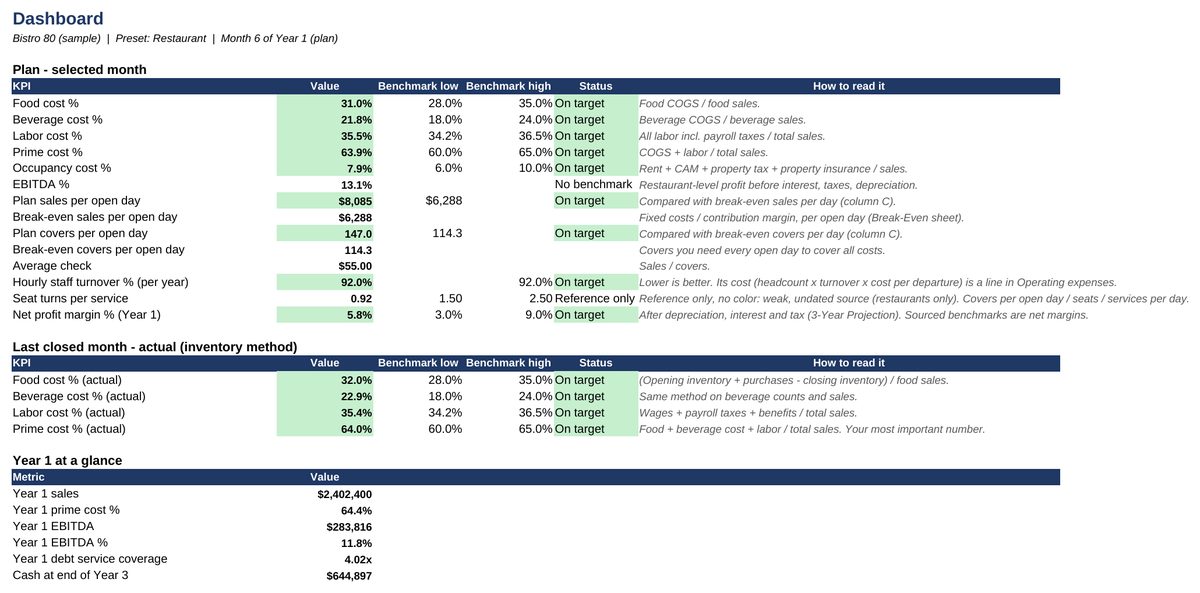
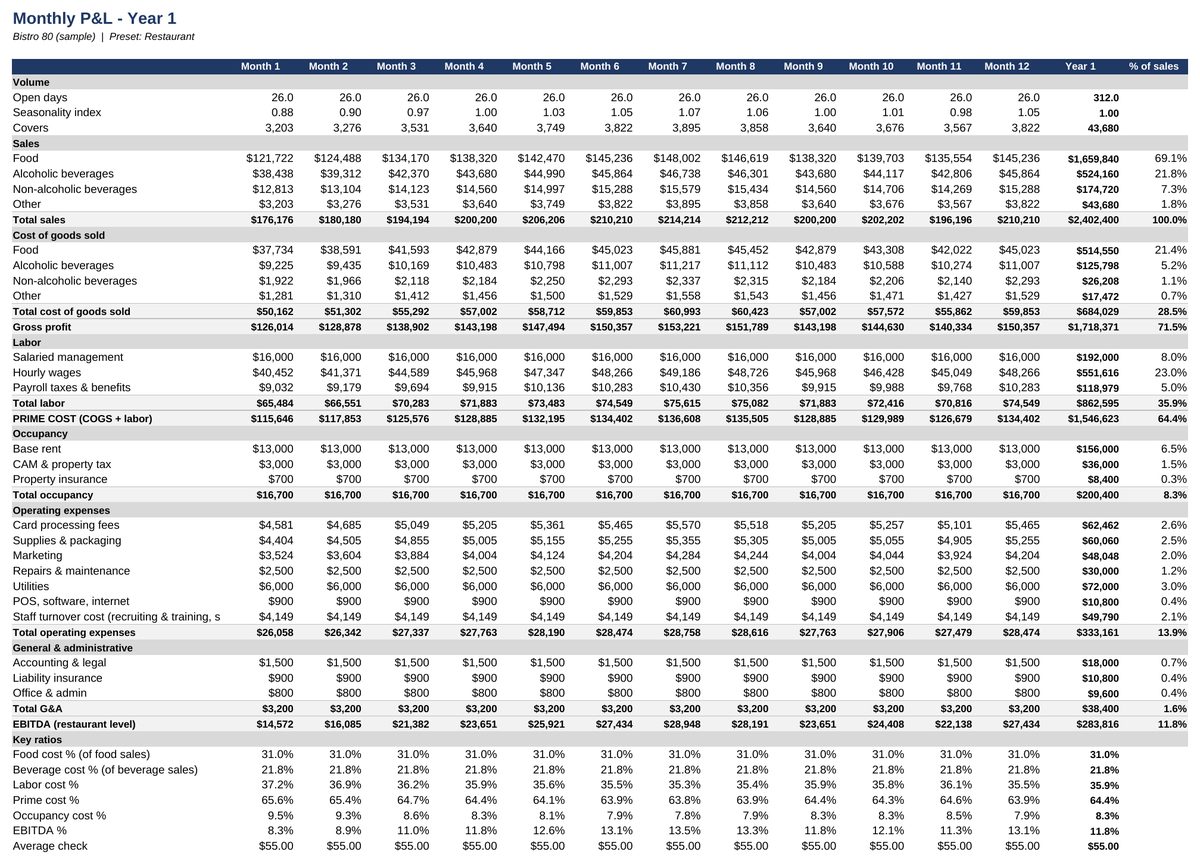
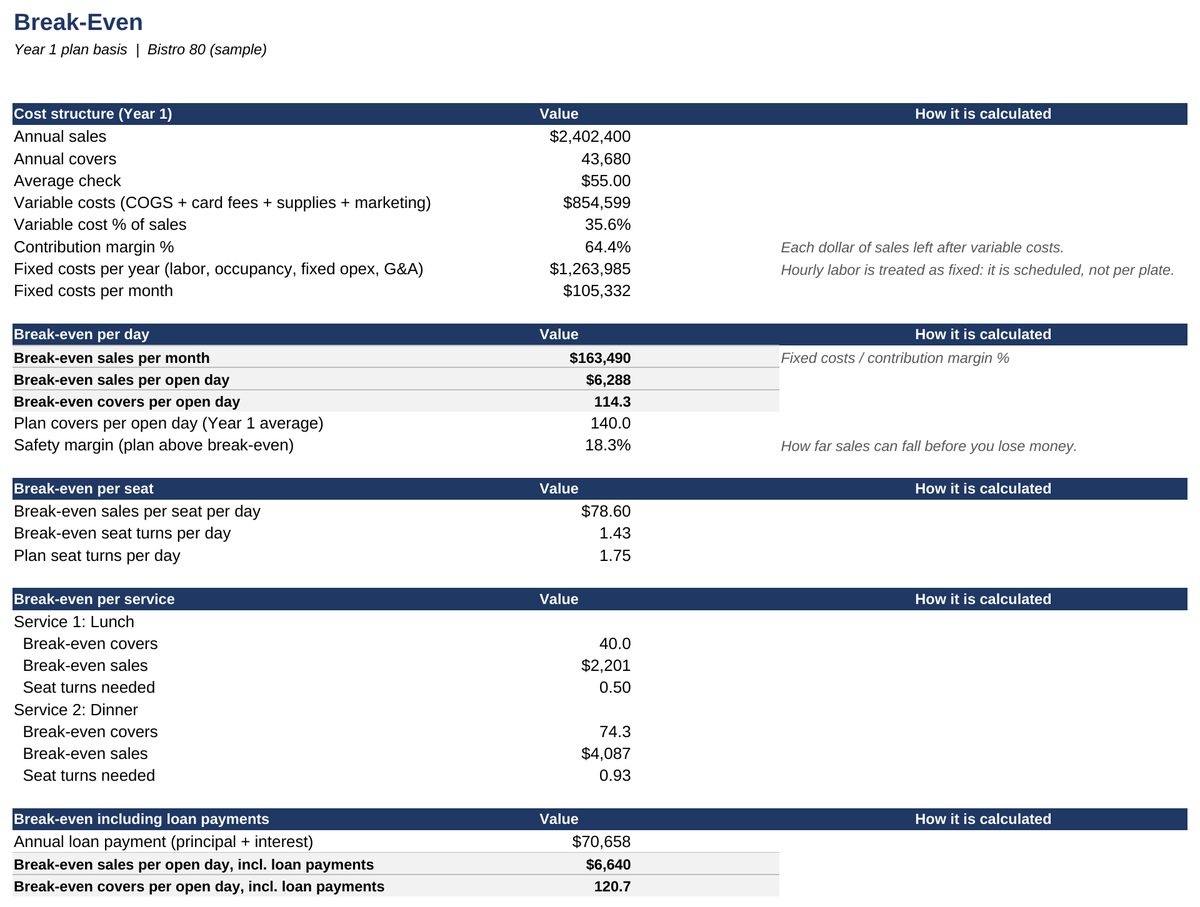
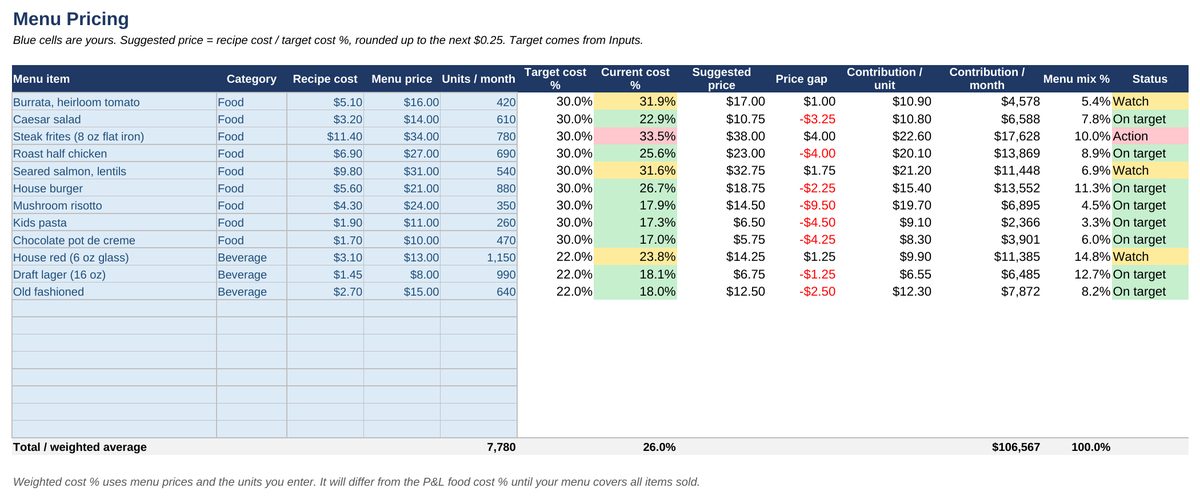
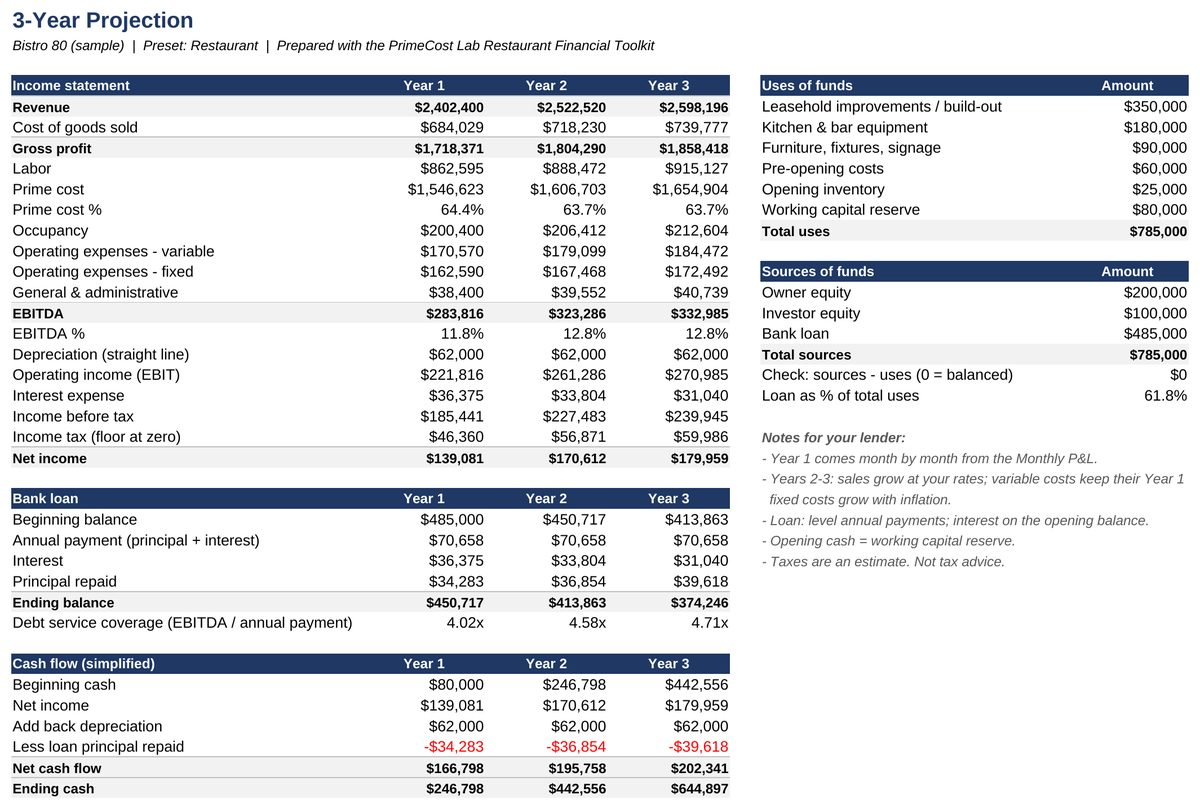
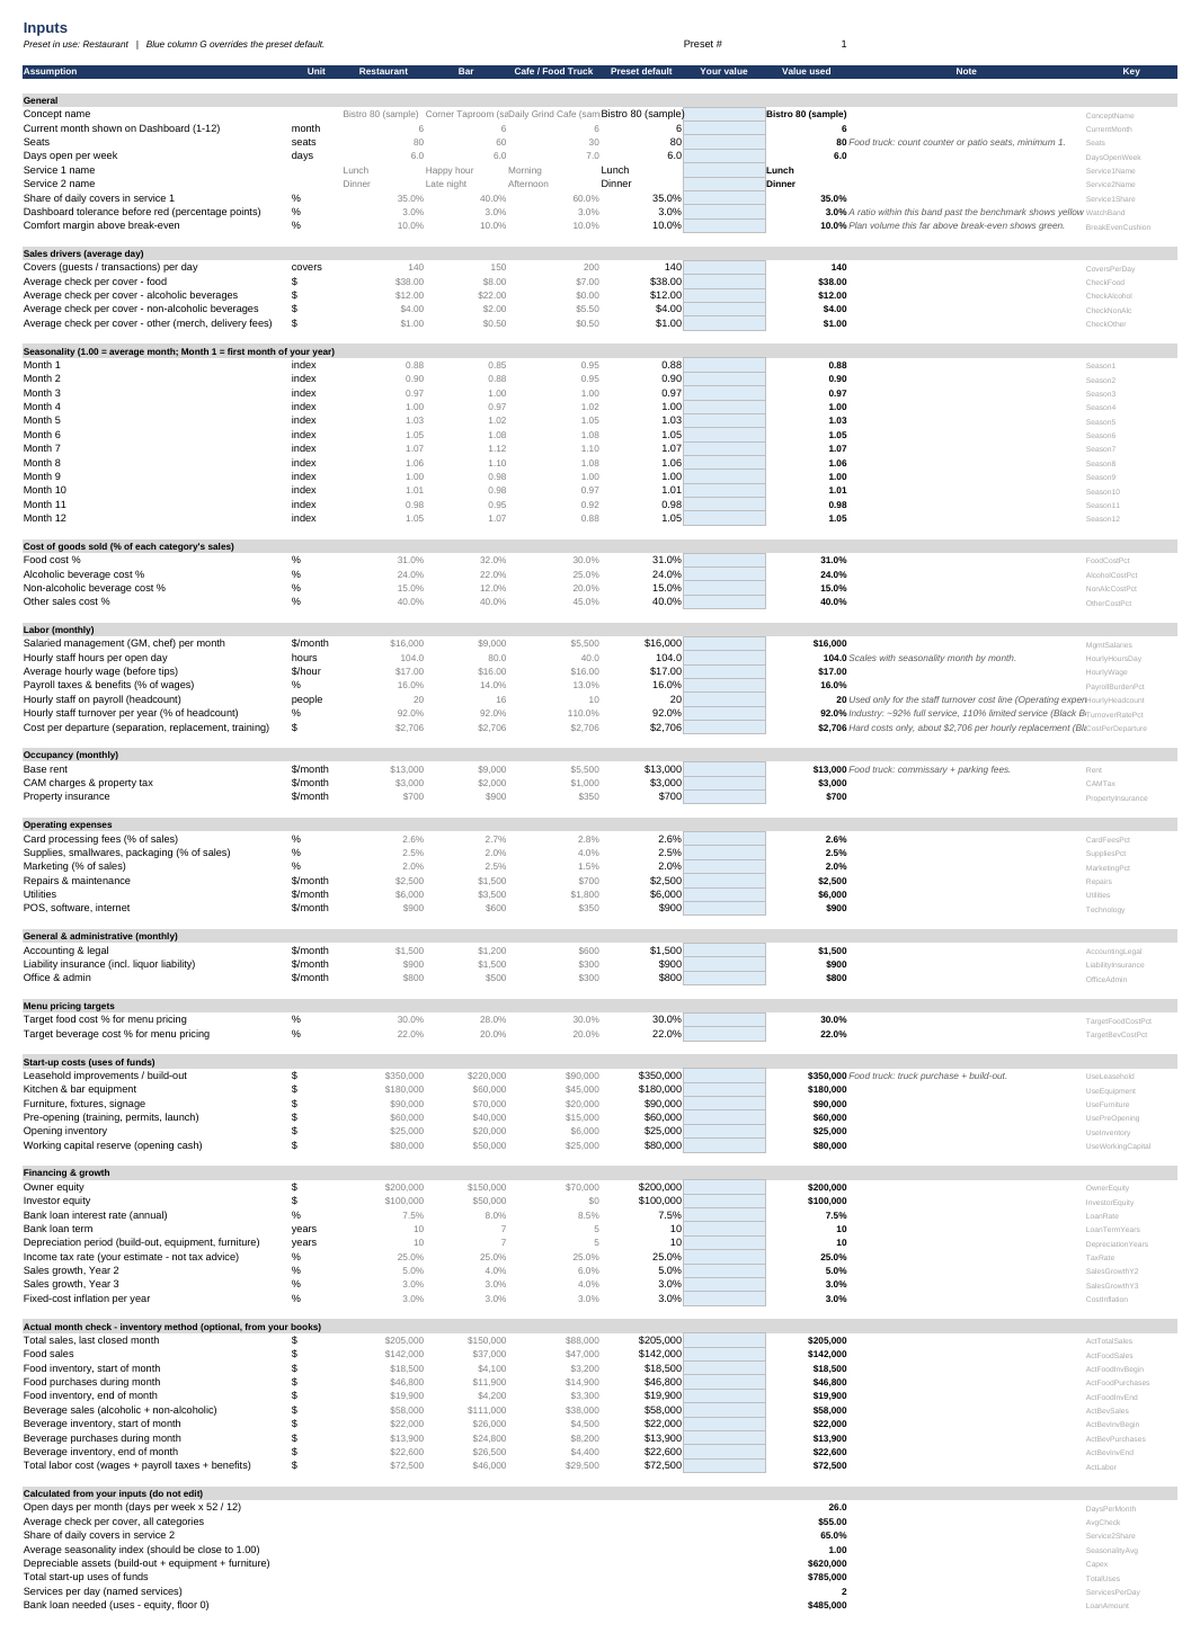
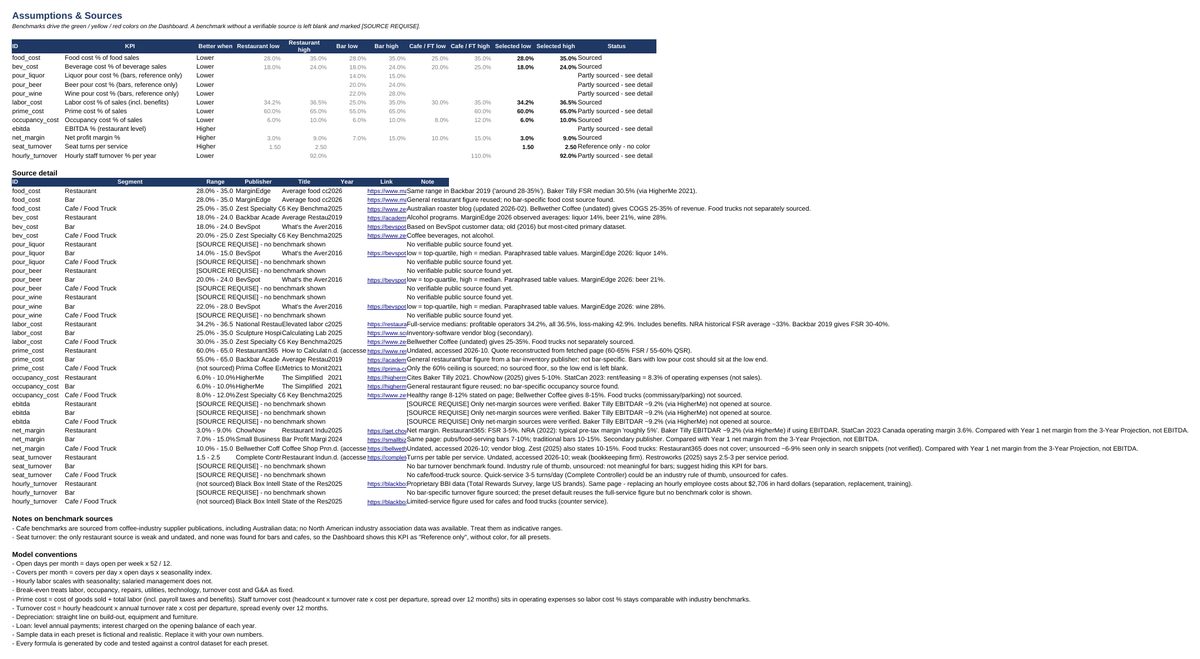
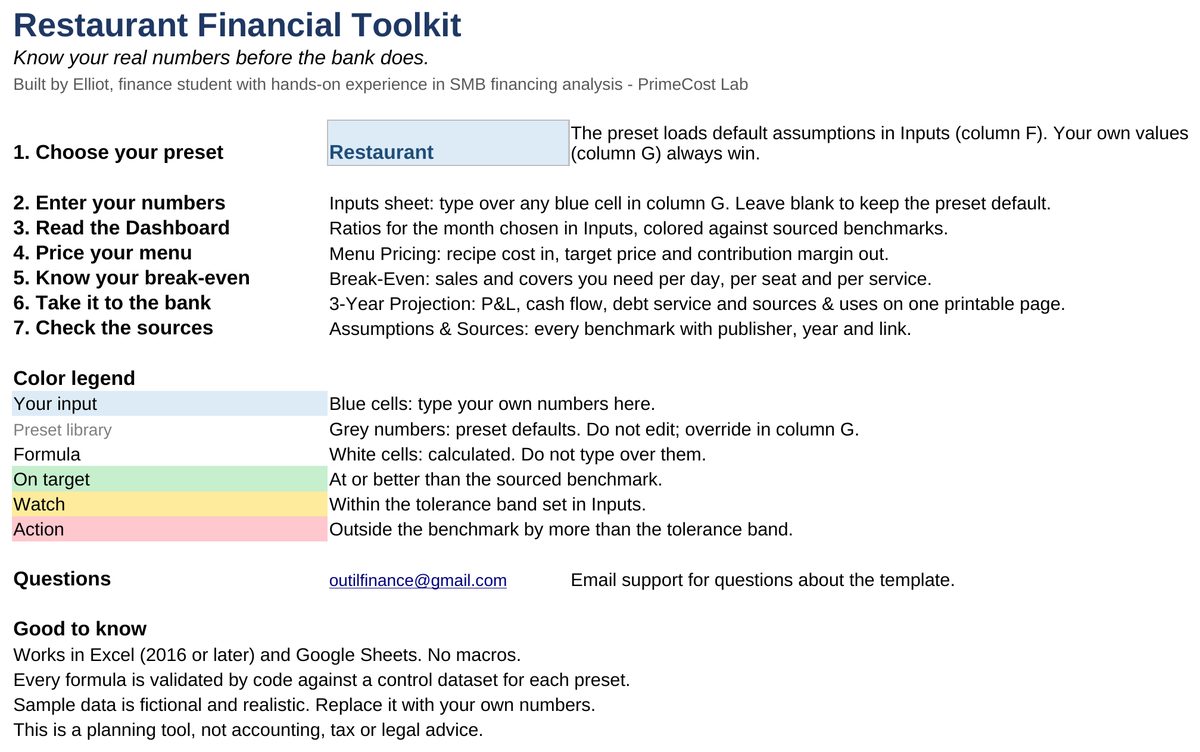
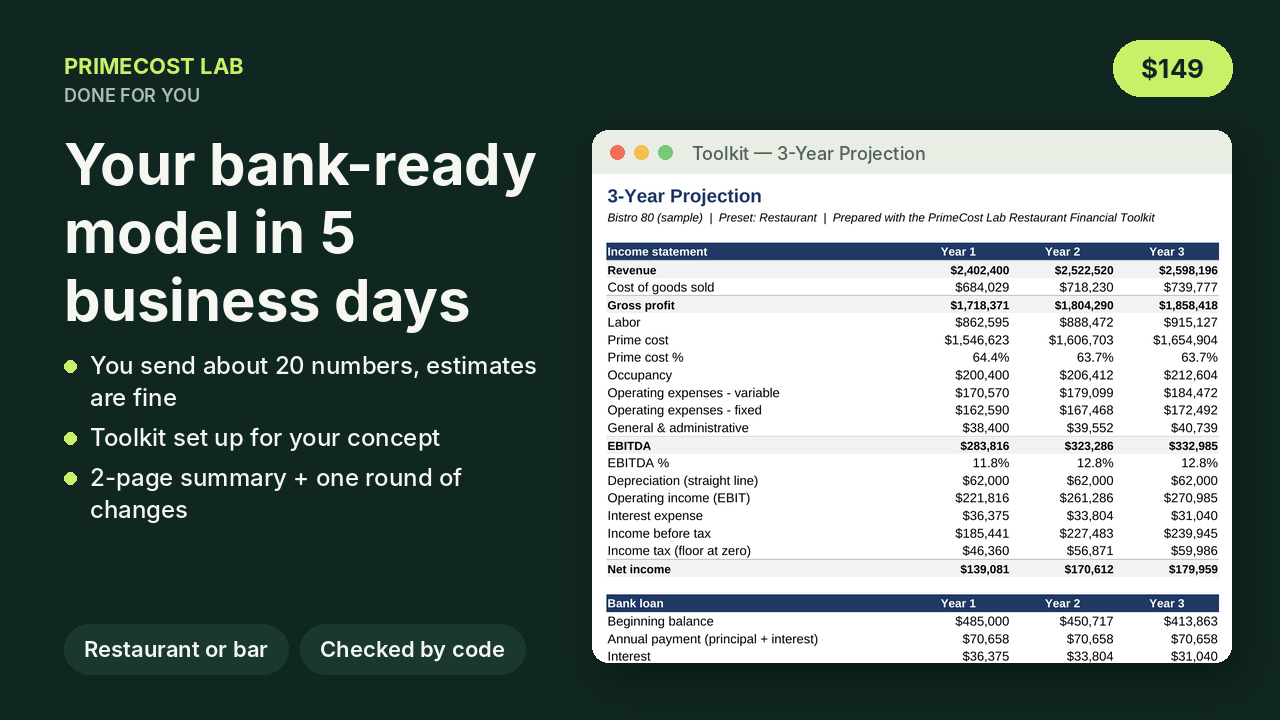
Open the calculator →Real screenshots of the Restaurant preset (80 seats, 140 covers a day, $55 average check — fictional but realistic). Click to enlarge.
51 seconds, no sound. Real screenshots of the fictional Restaurant preset.


Start free. Upgrade when you need the P&L, the pricing sheet or a projection for a lender.
| What you get | Free calculator | Toolkit · $79 |
|---|---|---|
| Food, beverage, labor and prime cost % for one month, inventory method, color-coded | ✓ | ✓ |
| Sourced benchmarks with publisher and year | ✓ (4) | ✓ (all 76 inputs) |
| 12-month P&L with occupancy, operating expenses, staff turnover line, EBITDA | — | ✓ |
| Menu pricing for 20 items with menu mix | — | ✓ |
| Break-even per month, per day, per seat, per service, margin of safety | — | ✓ |
| 3-year projection, loan schedule, DSCR, sources & uses — one printable page | — | ✓ |
| Three presets (restaurant, bar, cafe / food truck) and a "Your value" column | — | ✓ |
| Excel 2016+ and Google Sheets, no macros | ✓ | ✓ |
| Email support · 14-day refund | ✓ | ✓ |
The Bar Inventory & Pour Cost Tracker ($49): 50-line inventory, pour cost by category vs sourced benchmarks, 20 cocktails priced from your own ingredient costs, 12-month bar P&L. Bundle it with the Toolkit for $99 instead of $128.
For an owner who needs a projection for a lender or an investor and has no time to fill 76 inputs.

Plain-English explanations of the numbers a lender will ask about, with worked examples. New owner? Start with prime cost, then break-even.
Divide recipe cost by your target food cost percentage. Worked example, common mistakes, and a weekly checklist for small operators.
Restaurant labor cost percentage with benefits: the formula, the NRA medians (34.2% and 36.5%), a worked example and a checklist for this week.
A free prime cost calculator for one month: what to enter, the formula, a worked bar example and the sourced benchmarks to compare against.
Industry pour cost benchmarks by category: liquor, beer, wine. Sourced data, calculation method, and free calculator.
Learn the beverage cost formula, see a worked example, and compare your pour cost to industry benchmarks for bars and restaurants.
Industry benchmarks for prime cost percentage by segment: full-service, bar, and cafe. Learn the target range and how to improve it.
Bar labor cost should be 25 to 35% of sales. Learn how to calculate yours, what to include, and when your percentage is too high.
Prime cost = COGS + total labor. Learn the formula, see a worked example, and download a free calculator to track yours monthly.
Step-by-step guide to calculate restaurant food cost percentage using beginning inventory, purchases, and ending inventory.
A full dining room does not mean profit. Check prime cost first: the 60% to 65% benchmark, a worked example and what to do this week.
Calculate turnover cost: headcount × rate × $2,706 per departure. Full-service restaurants lose ~92% of hourly staff yearly (Black Box Intelligence 2025). Track it monthly.
Learn the break-even formula for restaurants, see a worked example in covers per day, and understand how fixed costs and margin drive your threshold.
Ask them of any template, ours included. Here is how ours answers.
Screenshots of every sheet on this site, a 3-page sample PDF with no email asked, and a free calculator built by the same code as the paid files.
Each range names its publisher, title, year and link. Where no reliable source exists, the file shows no benchmark instead of a guess. See the full list.
Every result is a visible formula. No macros, no locked sheets, no hidden cells you cannot open.
An automated test suite rebuilds the files and checks them for errors and against control numbers before each release. What the tests check.
No. One payment, the file is yours, it works offline in Excel or in Google Sheets.
Full refund within 14 days, and email support from the person who built it.
Yes. The file uses only standard functions, no macros and no add-ins. Upload it to Google Drive and open it with Sheets; formatting and formulas carry over. Excel 2016 or later on Windows and Mac works as well.
The free calculator covers one month of actuals: food, beverage, labor and prime cost from 10 numbers, color-coded. The Toolkit adds a 12-month P&L, menu pricing for 20 items, break-even per day / per seat / per service, a 3-year projection with loan schedule and DSCR, three presets and 76 documented assumptions. If you only need to check last month, the free file is enough.
Each one is listed on the Assumptions & Sources sheet with publisher, title, year and link: MarginEdge (2026), Backbar Academy (2019), National Restaurant Association (2025), Restaurant365, Black Box Intelligence (2025), Zest Specialty Coffee Roasters (2025) among others. Where no reliable source exists, the sheet says 'No benchmark' rather than inventing one.
Yes. Three presets ship in the file (80-seat restaurant, 60-seat bar, 30-seat cafe / food truck) with segment-specific targets. Replace the light-blue inputs block by block with your own numbers.
The 3-Year Projection prints on one page with the figures a lender asks for: annual P&L, loan schedule, DSCR, sources and uses. It is a planning model built by a finance student with hands-on experience in SMB financing analysis, not a substitute for your accountant's statements.
Full refund within 14 days, no questions. Email support is included.